
Financial Return on Investment
 Although funders or investors are probably more interested at this stage in a social return on their investments, it may also interest them to see that your organization is benefiting financially from the investment, particularly if you are able to leverage the investment to extend or enhance the services you currently offer to your clients.
Financial Return indicators can provide information about the performance of an investment. However, for organizations launching a new SBCC product, service or intervention to improve public health, it can be most useful to look at the potential rate of cost recovery from the sale of the new product, service or intervention.
Conducting cost and revenue analyses will help you develop a baseline of programmatic and financial data for your organization. It provides a picture of the current situation and helps your organization identify ways to increase cost efficiency and revenue generation.
Types of Financial Return Indicators
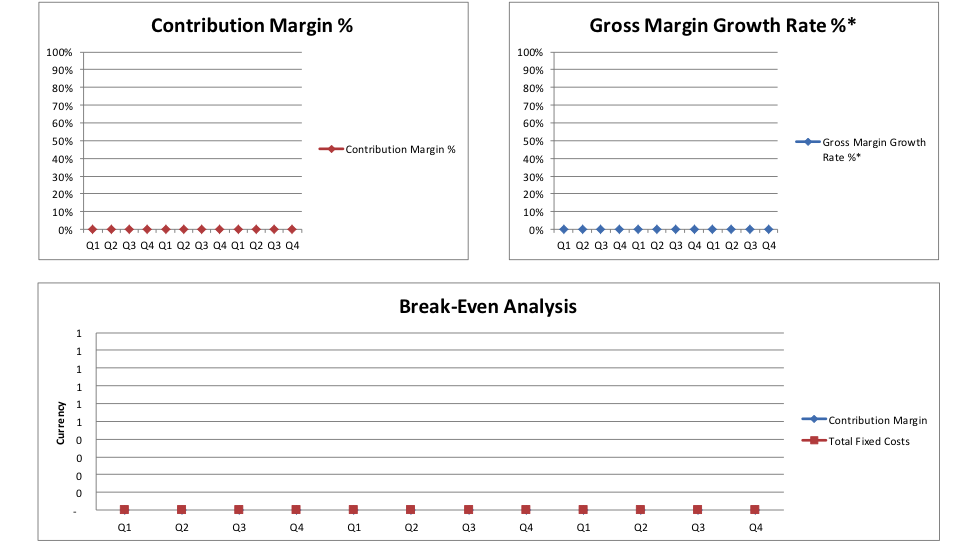
Contribution Margin % (Contribution Margin/Total Revenue): Contribution Margin is the leftover profits made after accounting for variable costs. Contribution Margin % is expressed as Contribution Margin over Total Revenue.
Gross Margin % (Gross Margin/Total Revenue): Gross Margin is the leftover profits made after accounting for variable costs and fixed costs. Gross Margin % is expressed as Gross Margin over Total Revenue.
Gross Margin Growth Rate % ((Current Gross Margin – Prior Gross Margin) / (Prior Gross Margin)): Gross Margin Growth Rate % is the percent increase in Gross Margin from one period to the next.
Break-Even Analysis: Break-Even Analysis is used to determine the point at which profits exceed total costs (both variable and fixed costs). Under the “Financial Charts” tab, you will be able to identify at which point in the three-year period your product, service or intervention will become profitable. This is indicated at the cross section of the Contribution Margin and the Fixed Expenses.
Financial Return Worksheet
Instructions: Read and complete the following steps.
- Prepare a brief statement explaining the Financial Objectives that will be used to measure the financial return on the investment.
- Select and list the financial performance indicators that you will use to measure the return on investment.
- The financial indicators in the table below are automatically calculated and graphed in the Financial Modeling Tool and can be found at the bottom of the “Product Forecast” tab and in the “Financial Charts” tab.
Financial Modeling Tool
Proceed to the Financial Modeling Tool to see the Product Forecast and Charts.
Financial Modeling Tool (Product Forecast)
Financial Modeling Tool (Charts)